
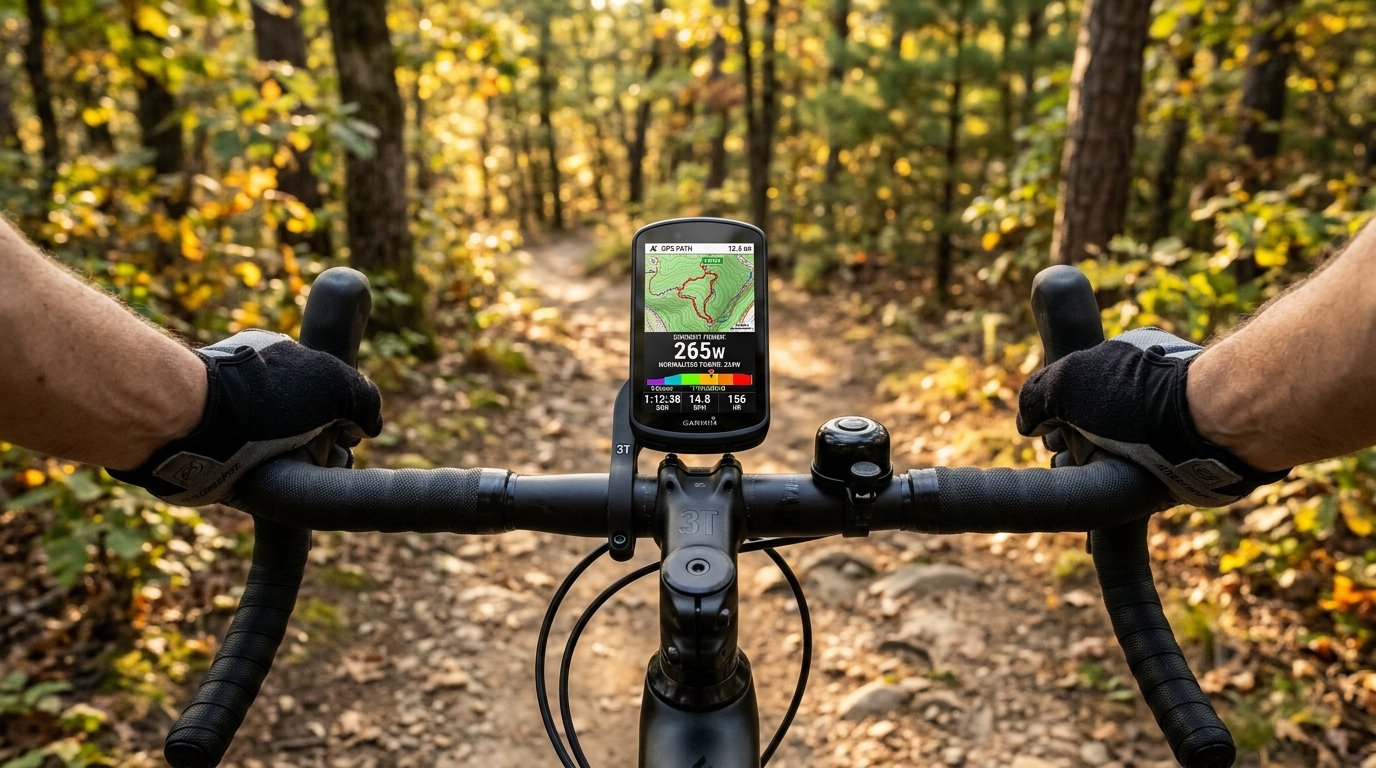
Whether you are navigating remote singletrack or executing high-intensity intervals, choosing the right GPS cycling computer is critical for accurately tracking real-time power metrics, following precise route navigation, and ensuring seamless sensor integration.
Modern cycling head units do far more than log speed and distance. They serve as the nervous system of your endurance rig, managing dual-band wireless protocols (ANT+ and Bluetooth Smart) to aggregate data from spider, pedal, or crank-based power meters. For plant-powered endurance athletes and mountain bike racers balancing intense outdoor sessions with structured off-season base building, selecting a head unit with superior display readability, advanced power metrics like Normalized Power (NP) and Training Stress Score (TSS), and robust satellite navigation is essential for optimizing long-term athletic adaptation.
Technical Architecture: Wireless Protocols, Power Metrics & Display Science
                    GPS HEAD UNIT DATA & DISPLAY AXIS
│                                                                        │
│  Power Meter / HR Sensors ──► ANT+ / Dual-Band BLE Protocol Sync       │
│                                           │                            │
│                                           ▼                            │
│  On-Board Algorithm       ──► Calculates NP, IF & TSS Metrics Real-Time│
│                                           │                            │
│                                           ▼                            │
│  MIP / OLED Screen Tech   ──► High Contrast Readability Under Sunlight │
Selecting the ideal bike computer requires evaluating three core technological pillars:
Sensor Connectivity (ANT+ vs. Bluetooth Smart): ANT+ utilizes a low-power, 2.4 GHz mesh network protocol capable of broadcasting data simultaneously to multiple head units and wearables. In contrast, Bluetooth Smart (BLE) employs point-to-point connections with higher data transfer rates. Dual-band units that support both protocols prevent signal dropouts across power meters, heart rate straps, and smart trainers.
Real-Time Workload Quantification (NP & TSS): Average power fails to account for the exponential physiological cost of surges, headwinds, and steep climbs. On-board calculation of Normalized Power (NP)—which uses a 30-second rolling average raised to the fourth power—alongside Intensity Factor (IF) and Training Stress Score (TSS), gives athletes an accurate picture of metabolic glycogen expenditure during live rides.
Display Technology & Sunlight Visibility: High-end units utilize Memory-in-Pixel (MIP) or anti-glare, ambient-light-adjusting color screens. MIP displays reflect ambient sunlight to increase contrast, making them exceptionally readable during bright outdoor rides while conserving battery power compared to traditional backlit LCD screens.
Head-to-Head: Feature Comparison Across Bike Computer Classes
| Feature / Metric | Compact / Entry-Level Units | Mid-Tier Performance Units | Premium Flagship Navigation Units |
| Primary Use Case | Basic data logging & small rides | Structured training & XC racing | Remote gravel, bikepacking & multi-day |
| Display Type | Monochromatic / Basic LCD | MIP / Transflective Color | High-Res Color Touchscreen |
| GNSS Satellite Support | Standard GPS / GLONASS | Multi-Band / Dual-Frequency GNSS | Multi-Band GNSS + Full Offline Topo |
| Power Data Metrics | Instantaneous & 3s Average Power | NP, IF, TSS, Left/Right Balance | Advanced Cycling Dynamics & NP Target |
| Battery Life (GPS Mode) | 10–15 Hours | 15–24 Hours | 30–45+ Hours (Solar Options) |
—–
The Plant-Based Fueling & Recovery Connection: Data-Driven Fuel Timing
Pairing real-time training metrics with precision nutrition prevents catastrophic glycogen depletion during demanding outdoor rides:
                DATA-DRIVEN PLANT FUELING & HYDRATION MATRIX
│                                                                          │
│  Real-Time Kilojoules (kJ) ──► Direct Measure of Glycogen Spent          │
│                                           │                              │
│                                           ▼                              │
│  Hourly Carbohydrate Alert ──► 60-90g/hr (Maltodextrin + Fructose)       │
│                                           │                              │
│                                           ▼                              │
│  Post-Ride TSS Calculation  ──► Targeted Plant Protein & Electrolyte Meal│
Kilojoule-to-Carbohydrate Tracking: Total work performed in Kilojoules (kJ) closely mirrors gross caloric expenditure. Tracking cumulative kJ on your head unit allows plant-based endurance athletes to maintain precise 60-90g/hr exogenous carbohydrate intake rates during long Zone 2 and threshold efforts.
Timed Hydration Prompts: Modern GPS computers allow customizable, metric-based alarms. Program your unit to trigger a drink prompt every 15-20 minutes to override cold-weather thirst blunting or high-intensity voluntary dehydration.
TSS-Driven Post-Ride Recovery: Evaluating post-workout TSS scores dictates exact recovery requirements. High-TSS sessions (>200) call for immediate anti-inflammatory, polyphenol-dense plant meals paired with high-leucine plant protein isolate blends.
Actionable Integration & Setup Protocol
Perform Dual-Protocol Sensor Audits: Ensure your power meter broadcasts via ANT+ to your head unit while reserving Bluetooth connections for mobile app syncing or smart trainer Erg mode control.
Customize Data Screens by Workout Type: Build distinct profile screens—one for race/interval days (3s Power, Target NP, Lap Time, Heart Rate) and one for endurance navigation (Map, Distance to Next Turn, Total Elevation, Elapsed Time).
Calibrate Zero-Offset Before Every Ride: Execute a manual zero-offset (calibration) on your power meter via the head unit prior to rolling out to prevent temperature-induced power drift.
Integrating Tech & Gear Science with Full-Spectrum Training
Combine your GPS head unit data with strength protocols, indoor trainer transitions, and sleep tracking:
Indoor Trainer Setup: Connect your head unit to Erg mode during winter base building in Transitioning to Indoor Smart Trainers: Power Meter Accuracy and Virtual Training Setup.
Off-Road Power Mechanics: Apply your power metrics to single-leg trail riding in Bilateral vs. Unilateral Strength Training for Cross-Country Mountain Bikers.
Wearable Autonomic Recovery: Sync outdoor TSS data with recovery metrics covered in Smartwatch Sleep Tracking in Winter: Analyzing Deep Sleep, HRV, and Overtraining Alerts.
Outdoor Thermoregulation: Keep your head unit running and hydration timed during cold rides using Cold-Weather Endurance Performance: Managing Core Thermoregulation and Hydration Drop-Off.
Post-Ride Glycogen Refueling: Pair high-TSS rides with nutrient-dense recovery in Seasonal Root Vegetables and Ancient Grains: Optimizing Complex Carbs for Autumn Training.
Ready to optimize your cycling data, dial in your training metrics, and elevate your performance with evidence-based coaching? Explore how Online Fitness Coaching can help you achieve your goals today!
References
Allen, H., Coggan, A. R., & McGregor, S. (2019). Training and racing with a power meter (3rd ed.). VeloPress.
Atkinson, G., Davison, R., Jeukendrup, A. E., & Passfield, L. (2003). Reliability of power output during cycling: A review. Sports Medicine, 33(11), 813–831.
Friel, J. (2012). The power meter handbook: A user’s guide for cyclists and triathletes. VeloPress.
Impellizzeri, F. M., Marcora, S. M., & Coutts, A. J. (2019). Internal and external training load: 15 years on. International Journal of Sports Physiology and Performance, 14(2), 270–273.